
Consolidated Financial Highlights
As we carried out a share consolidation with a 10:1 ratio of common shares with an effective date of Oct. 1, 2017, Book Value per Share, Earnings per Share and Cash Dividends per Share has been calculated with the assumption that this share consolidation was carried out at the beginning of the fiscal year 2013.
We have adopted IFRS (International Financial Reporting Standards) since the first quarter of FY2022, and its financial information for the comparative fiscal year, FY2021, is also based on IFRS.
We have adopted IFRS (International Financial Reporting Standards) since the first quarter of FY2022, and its financial information for the comparative fiscal year, FY2021, is also based on IFRS.
All the data on this page are calculated on a consolidated basis.
| |
FY2022 | FY2023 | FY2024 |
|---|---|---|---|
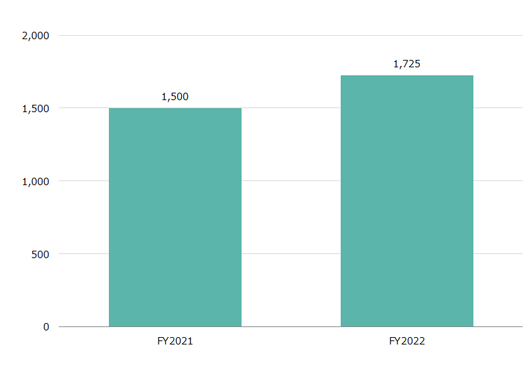
| Revenue (Billions of yen) |
1,725 | 1,849 | 2,129 |
| Business Profit (Billions of yen) |
82 | 46 | 143 |
| Profit before tax (Billions of yen) |
70 | 31 | 107 |
| Profit attributable to owners of parent (Billions of yen) |
53 | 27 | 88 |
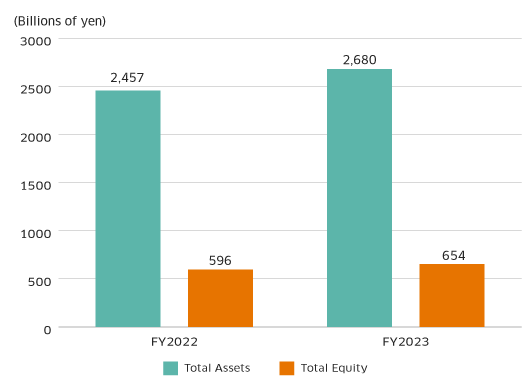
| Total Assets (Billions of yen) |
2,457 | 2,680 | 3,016 |
| Total Equity (Billions of yen) |
596 | 654 | 725 |
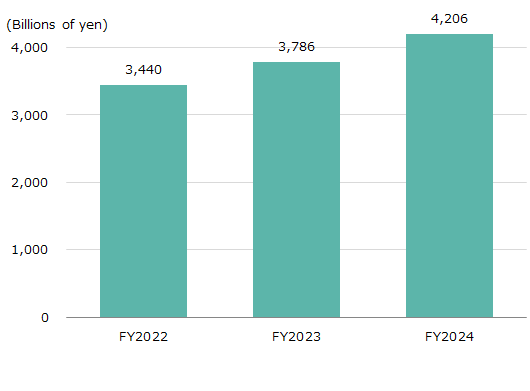
| Equity attributable to owners of parent per share (Yen) |
3,440.39 | 3,785.57 | 4,205.63 |
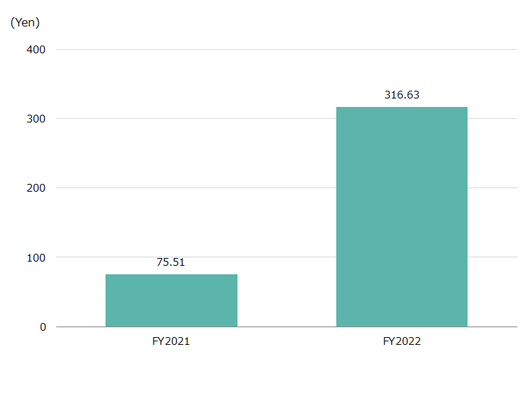
| Basic Earnings per Share (Yen) |
317 | 152 | 525 |
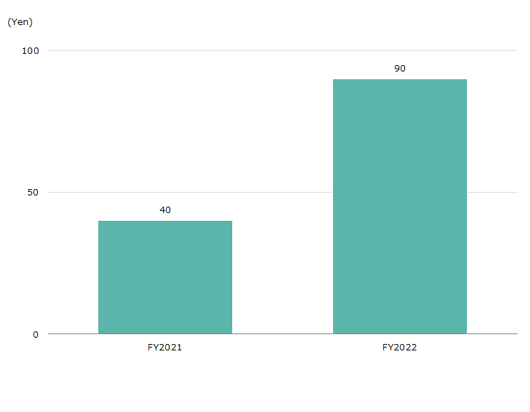
| Cash Dividends per Share (Yen) |
90 | 50 | 150 |
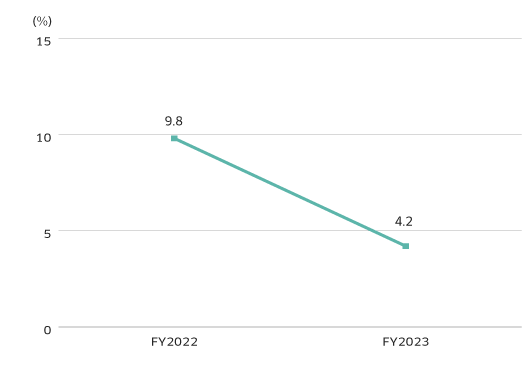
| Return on Equity attributable to owners of parent (%) |
4.8 | 4.2 | 4.1 |
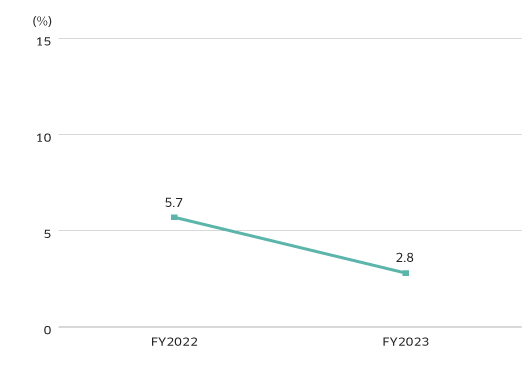
| After-tax ROIC (%) |
5.7 | 2.8 | 8.0 |
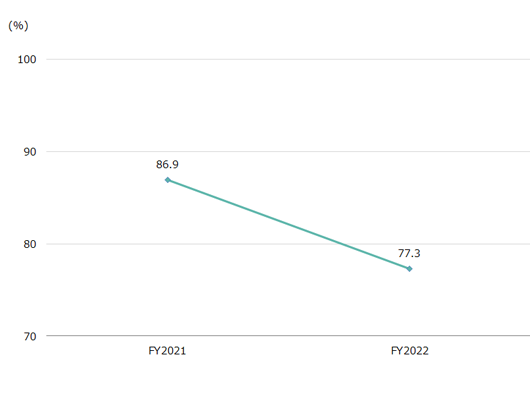
| NET Debt Equity Ratio (%) |
77.3 | 88.6 | 78.4 |
Revenue
Business Profit・
Profit attributable to owners of parent

Total Assets・Total Equity
Equity attributable to owners of parent per share
Basic Earnings per Share (EPS)
Cash Dividends per Share
Return on Equity attributable to owners of parent (ROE)
After-tax ROIC
NET Debt Equity Ratio
Contact
If you need more information about our business,
please feel free to contact us.


